


News in evidenza:
Una campagna internazionale per studiare la geologia profonda del Mare Adriatico e migliorare la conoscenza dei terremoti sottomarini
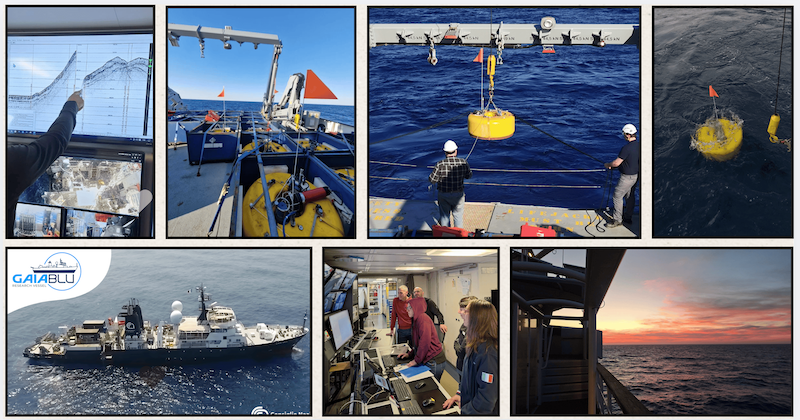
Si è appena conclusa la campagna oceanografica TRACE, un esperimento multidisciplinare dedicato allo studio della struttura geologica profonda e della sismicità della porzione meridionale del Mare Adriatico e nelle Zone Economiche Esclusive di Italia, Croazia e Montenegro.
La campagna prevede il dispiegamento di 20 sismometri sul fondo del mare, tra 800 e 1200 metri di profondità.
Ulteriori informazioni

Un podcast per parlare di Terra con le ricercatrici e i ricercatori della sezioneINGV di Bologna.
Si fa presto a dire Terra, ma come si studia un pianeta?
Come esploriamo la profondità del pianeta? Come è possibile decifrare le cause di fenomeni che sono tanto più grandi di noi, che sono spinti da forze che non vediamo ma sono in grado di sollevare le montagne, e di allargare gli oceani?
Ne parliamo in un podcast., le voci di ricercatrici e ricercatori ci racconteranno di esperimenti e di calcoli, di osservazioni e di analisi, di pericolosità e della sua percezione. Le voci di ricercatrici e ricercatori ci racconteranno di esperimenti e di calcoli, di osservazioni e di analisi, di pericolosità e della sua percezione
.

Wolstenholme Fjord - Uummannap Kangerlua, Greenland
Osservatorio HySO, monitoraggio del cambiamento climatico globale.
E' ora online il sito web The Hydro-Seismological Observatory (HySO) che presenta la rete multi-parametrica (sismica e idro-metrica) installata in Groenlandia.
L'obiettivo primario di HySO è lo studio della dinamica dei ghiacciai e della perdita di massa di ghiaccio dalla calotta polare, utilizzando congiuntamente dati sismici e idrometrici di alta qualità.
I dati sono pubblici e disseminati attraverso i canali istituzionali e internazionali.
La sezione INGV di Bologna
Già sede INGV dal 2002, la Sezione di Bologna dell’Istituto Nazionale di Geofisica e Vulcanologia viene istituita nel 2005. Forte di un organico di circa 80 persone, la Sezione si distingue per l’ampia varietà dei temi di ricerca scientifica, che abbracciano i tre Dipartimenti dell’INGV: AMBIENTE, TERREMOTI e VULCANI.
I Servizi Amministrativi della Sezione sostengono la ricerca in tutti i suoi aspetti e contribuiscono alla gestione di attività e progetti.
La ricchezza di competenze e profili professionali stimola l’approccio interdisciplinare e favorisce lo sviluppo di ricerche su temi trasversali ai tre Dipartimenti. Ad esempio: la ricerca storica ricostruisce e cataloga eventi sismici, vulcanici o climatici del passato; e lo studio del cambiamento climatico, integra informazioni ricavate dalla sismicità di origine glaciale.
Ci dedichiamo volentieri alla comunicazione della scienza, organizzando eventi e proponendo percorsi didattici dedicati alle Scienze della Terra e alla mitigazione dei rischi naturali.
Partecipiamo a diversi gruppi operativi che intervengono sul territorio in emergenze sismiche o vulcaniche
La Sezione collabora con le Università e accoglie studenti per tirocini, tesi di laurea e dottorati
Alcuni articoli scientifici recenti:
Nel 1904, il professor Francesco Cavani, su incarico del Comune di Bologna, fu chiamato a valutare la stabilità della Torre Garisenda. A tal fine, sviluppò un innovativo sistema di monitoraggio, basato su un filo a piombo fissato a circa 40 metri di altezza sulla parete Sud e su cannocchiali specializzati, dotati di un doppio sistema di lenti e fuochi, in grado di rilevare spostamenti con una precisione fino a un ventesimo di millimetro. Le tavole allegate alla sua relazione presentano in dettaglio i dati di monitoraggio, comprensivi delle serie temporali degli spostamenti verso Est e Nord, rappresentate in scala ingrandita 20:1. In questo studio, le serie originali sono state digitalizzate, scalate ed esportate per essere analizzate con metodi moderni. L’obiettivo è quello di estrarre informazioni sulle caratteristiche dinamiche del movimento della torre, sia nel dominio del tempo che in quello delle frequenze. I risultati ottenuti mettono in evidenza le oscillazioni e le relative ampiezze, offrendo una lettura moderna e aggiornata del comportamento dinamico della struttura a oltre un secolo di distanza. Questo lavoro si propone come strumento per divulgare alcune informazioni di base sul comportamento della torre nel passato, al fine di valutare, in studi futuri, eventuali cambiamenti significativi nella caratterizzazione cinematica dei suoi movimenti. Inoltre si annunciano futuri sviluppi per aumentare la comprensione dei limiti spaziali e temporali dei risultati in considerazione delle imperfezioni dei grafici storici.
DOI

Abstract: This article presents a texture mapping procedure for transferring information from historical images, potentially dating back several decades, even to the late 19th century, onto a three-dimensional (3D) model representing the current condition of the studied system. The method is implemented as a MATLAB toolbox, initially developed for 3D infrared thermography and subsequently modified and adapted to allow fast texture mapping using a variety of historical image types, including photographs, postcards, and technical maps (COMAP3 toolbox, freely available under a General Public License). This approach ensures accurate alignment and reliable integration of the images onto the 3D model. Besides the point cloud onto which data from one or more historical images are projected, the procedure includes quality analysis of the results in terms of residuals, defined as differences between moving points recognized manually or automatically via a feature-based approach, and transformations of the corresponding fixed points. It also evaluates the actual ground pixel size with respect to the ground sampling distance for each pixel. The paper demonstrates the method’s effectiveness through a dedicated test and applies it to the parish church of San Giorgio in Argenta, Ferrara, Italy, mapping flood levels from 1917, 1955, and 2024 onto a photogrammetric point cloud.
DOI

On March , 2023, three small earthquakes (3.8<Mw<4.5) occurred near Umbertide (Central Italy), within 4 hours. Analyzing seismic ambient noise in the frequency band 0.1–1 Hz from six seismometers within 20 km of the Mw 4.5, we detect a significant drop in seismic velocity at the time of occurrence of the seismic sequence. A strain sensitivity analysis suggests that crustal damage was primarily caused by the passage of seismic waves, likely enhanced by the presence of fluids. Analyzing geodetic data from recently installed strainmeters and pore pressure transducers, we highlight the role of elastic strain and fluids in driving deformation during this sequence, suggesting the presence of a pressure source that strongly influences the deformation pattern. We find that fluid-induced stress may cause the reloading of a few kPa of a co-seismic asperity within hours, unveiling the contribution of pore pressure sources to the stress budget of seismogenic faults.
DOI

Above the magnitude of completeness - the minimum threshold for which a 100% detection rate is assumed - earthquake magnitudes are typically modeled as a continuous exponential distribution. In practice, however, earthquake catalogs report magnitudes with finite resolution, resulting in a discrete (geometric) distribution. To determine the magnitude of completeness, the Lilliefors test is commonly applied. Because this test assumes continuous data, it is standard practice to add uniform noise to binned magnitudes prior to testing exponentiality. Here we show analytically that uniform dithering does not recover the underlying continuous exponential distribution from its discretized (geometric) form. It instead returns a piecewise-constant residual lifetime distribution, whose deviation from the exponential model becomes detectable as catalog size or bin width increases. Through numerical experiments, we demonstrate that this deviation yields a systematic overestimation of the magnitude of completeness, with biases exceeding one magnitude unit in large, high-resolution catalogs. We derive the exact noise distribution - a truncated exponential within each magnitude bin - that correctly restores the continuous exponential distribution over the whole magnitude range. Numerical tests show that this correction yields Lilliefors rejection probabilities that are consistent with the significance level across a wide range of bin widths and catalog sizes. Although illustrated for the Lilliefors test, the identified bias and the proposed correction are independent of the specific statistical test and apply generally to exponentiality testing of discretized magnitude data.
DOI

The liquefaction of gravelly soils during earthquakes remains a challenging hazard to evaluate because larger soil particles can interfere with traditional in situ tests such as the standard penetration test (SPT) and cone penetration test (CPT). This study investigates six sites affected by the 2020 Mw 6.4 Petrinja, Croatia earthquake, where gravelly liquefaction ejecta was observed. Subsurface investigations included boreholes to define the soil profile, shear wave velocity (Vs) profiling using the multichannel analysis of surface waves (MASW) and horizontal to vertical spectral ratio (HVSR), and large-diameter (74-mm) dynamic cone penetration tests (DPT). At several sites, DPT blow counts increased through silty clay surface layers, whereas CPT tip resistance from companion testing remained constant. The increase in DPT resistance was thus attributed to side friction along the drill rods, and two subsequent DPT soundings were conducted to isolate this effect: (1) a cased DPT (cDPT), where the overlying material was removed and the hole was cased to the target gravelly layer; and (2) an instrumented DPT (iDPT), used to measure the hammer energy transferred to the cone. Corrected DPT blow counts (N120′) and normalized shear wave velocities (Vs1) from critical gravelly layers were evaluated using recent probabilistic DPT- and Vs-based liquefaction triggering models. These methods correctly predicted liquefaction manifestation at each of the sites. Results support the continued development of energy-corrected DPT and Vs-based approaches for liquefaction assessment in gravelly soils and provide valuable case history data to continue refining probabilistic triggering relationships.
DOI

Geophysical investigations and studies on the local seismic noise are of paramount importance for evaluating the candidate locations for hosting Einstein Telescope (ET), the third-generation gravitational wave detector. In the Italian candidate site, several active and passive geophysical acquisitions have been carried out, mainly focusing on the imaging of the shallow subsurface, while a full characterization of the noise wavefield was lacking. In this work, we present the results from three temporary seismic arrays installed at the Italian candidate site, each with different geometrical layouts, recording durations, and total numbers of stations. Here, we provide an overview on the seismic noise characteristics and its azimuthal distribution, obtained through beamforming. Moreover, we leverage the noise recordings to extract (i) Rayleigh wave dispersion curves using fk analysis, which are then inverted to obtain a one-dimensional, shear-wave velocity model of the subsurface and (ii) HVSR spectra across all arrays' stations. The recordings confirm the exceptionally low level of seismic noise approaching Peterson's New Low Noise Model for frequencies > 1 Hz. The arrays allowed to reliably reconstruct the seismic wavefield in the 10–20 Hz range, showing an almost azimuthally homogeneous noise source distribution, with slowness values between 0.4 and 0.5 s/km. The inversion of dispersion curves in the same frequency range highlighted a rather homogeneous, high-velocity terrain (VS=2–3 km/s) in the first 100 m. The flat HVSR spectra across all arrays excludes the presence of a resonant, low-velocity layer at shallow depth.
DOI

The transition from oceanic subduction to continental collision and, eventually, to delamination is thought to control dynamics, magmatism/metamorphism, and tectonic/sedimentation style in orogens. We propose for the first time that the alternation of slow and fast orogenic wedge advance and backarc opening in the retreating Apennines subduction zone (central Mediterranean area) was controlled by the transition from oceanic subduction to soft-collision (subduction of hyperextended continental lithosphere), evolving to hard-collision (subduction of the necking domain), and eventually to delamination. The coupling between slab dynamics and the evolution of the orogen is revealed by an unprecedented joint analysis of magmatism/metamorphism, of timing and rate of migration of forebulging, thrusting, and backarc extension and of seismic heterogeneities in the slab. Oceanic subduction and soft-continental collision, testified by high pressure-low temperature metamorphism, was characterized by fast orogenic and backarc extension migration, fast rotation of Corsica and Sardinia and vigorous magmatism. Low shear velocity anomalies observed in along-dip tomographic profiles across the Apennines are interpreted as signatures of slab damage events associated with the diachronous (at 21 Ma in the Northern and at 18 Ma in the Central/Southern Apennines) underthrusting of the necking domain of Adria in the Northern and Central-Southern Apennines. This hard-collision stage was characterized by slow orogenic wedge advance and backarc opening. The heating and weakening of the subducting continental crust produced by hard-collision promoted the transition from continental subduction to delamination of the Adria lithosphere. This process occurred at ca. 9 Ma and led to a relocalization of the subduction interface from the base of the sedimentary cover into the ductile middle crust and was associated with a renewal of fast orogenic wedge advance and backarc opening.
DOI
We present a probabilistic framework for evaluating earthquake forecasting models that use an alarm-based approach. In this approach, alarms are triggered by specific precursor signals. In a previous paper we compared such models and two ensemble models combining them in additive and multiplicative mode, with the ETAS (Epidemic Type Aftershock Sequence) forecasting model, which is defined in a probability-based approach, by making the latter to issue an alarm when the expected rate exceeds a pre-defined threshold. In this work we compare the alarm-based models with the ETAS and with another probability-based model, EEPAS (Ever y Ear thquake a Precursor According to Scale) previously applied to Italy, using the testing procedures developed for probability-based models within the Collaboratory Study for Earthquake Predictability (CSEP) initiative. To do that, for the four alarm-based models, we compute empirical probabilities (frequencies) of Mw ≥5.0 earthquakes in Italy, inside and outside alarm time intervals issued by such models from 1990 to 2011. We then compare pseudo-prospectively the forecasting ability of all six models, by applying the CSEP tests on the time interval from 2012 to 2023. We found that the evaluation method used has a strong impact on the ranking of model performance. Probabilistic models like ETAS and EEPAS tend to score better under the CSEP testing framework whereas alarm-based models generally outperform probability-based ones when assessed using alarm-based metrics.
DOI
This study investigates the Salse di Regnano mud volcanoes within the framework of an INGV project by integrating geomorphological, geochemical, historical and remote-sensing data. Morphological and geochemical analyses reveal distinctive geometric features and enable reconstruction of the historical configuration of the area. Drone-based geomagnetic surveys combined with digitized historical maps transformed into normalized 3D models, together with high-resolution topography derived from Structure-from-Motion photogrammetry and satellite imagery, allow a comprehensive analysis of surface and subsurface patterns. The resulting geomagnetic anomaly maps display a tongue-shaped zone of low values descending from the northern upper slope into the main mud area and broadly aligning with relative morphological features, while additional anomalies highlight structures of potential geophysical interest. Historical evidence indicates a markedly different summit in the early 20th century, dominated by a prominent emission cone that reshaped the area following a paroxysmal event in the 1930s. These results demonstrate the value of integrating modern geophysical measurements with historical and morphological information to advance the understanding of mud volcano evolution.
DOI

In questo lavoro si presentano i risultati degli studi relativi all’anno 1930, ottenuti nel quadro della revisione della sismicità italiana degli anni Trenta dal punto di vista storico-macrosismico. Grazie alla disponibilità di nuove fonti (archivistiche e giornalistiche), e a partire da un rinnovato approccio metodologico, che ha portato alla rilettura della documentazione già conosciuta, sono stati aggiornati e accresciuti i dati degli eventi già inclusi in CPTI15-DBMI15 [Rovida et al., 2022; Locati et al., 2022]. È stato, inoltre, aggiunto un numero significativo di eventi che possono aumentare i dati disponibili in catalogo sotto due aspetti. L’aspetto quantitativo dei dati forniti dalla presente ricerca riguarda sia il numero di eventi, sia l’accresciuto numero di dati macrosismici. L’aspetto qualitativo riguarda la descrizione degli effetti nella maggior parte delle località investigate. Inoltre, sono stati inclusi altri eventi che per diversi motivi contribuiscono alla caratterizzazione sismica della penisola italiana e altri, infine, che non sono stati registrati dal servizio sismico coevo e che rischiavano di essere dimenticati. L’insieme dei dati si trova nell’appendice ed è raccolto in ottanta schede che corrispondono a 118 eventi.
DOI

From the paleoseismological and seismotectonic point of view, the intermountain basins of the Central Apennines of Italy are one of the most studied areas worldwide. Within this context, however, the Rieti Basin, bounded at its sides by active normal faults and with its peculiar rhombohedral shape, is a relatively overlooked area, and its most recent paleoseismological studies date back to the 90s. This is a key area both for completing the paleoseismological history of this sector of the chain and for understanding how the present-day extensional regime is accommodated through time by the faults bounding the basin. With this aim in mind, we excavated 17 paleoseismological trenches along the normal faults bordering the Rieti Basin (Central Apennines, Italy) and unveiled at least 6 paleoearthquakes that ruptured the faults during the last ca. 20 kyr. Our analysis of the paleoearthquake succession along the basin-bounding faults suggests that a spatial pattern is followed during sequences of rupturing events, with a maximum credible earthquake of Mw 6.5, consistently within this sector of the Central Apennines.
DOI

Il presente lavoro introduce PyGraph Scanner, un software in Python per la digitalizzazione automatica di grafici storici e analogici. Lo strumento nasce dall’esigenza di recuperare serie temporali archiviate su supporto cartaceo, difficilmente utilizzabili con strumenti digitali moderni, e fornisce un ponte tra le osservazioni del passato e le analisi quantitative contemporanee. Il codice utilizza una GUI basata su PySide6, l’elaborazione di immagini tramite OpenCV e la gestione dei dati con NumPy. A partire da pochi punti di riferimento selezionati dall’utente, l’algoritmo segue la traccia del grafico scorrendo in orizzontale e calcolando il centroide dei pixel compatibili per colore, garantendo robustezza al rumore e possibilità di intervento manuale in passaggi complessi. Il metodo è stato testato su grafici sintetici (rette, sinusoidi e composizioni a frequenze diverse), stampati e fotocopiati per simulare la degradazione dei documenti storici, introducendo volutamente disturbi di fondo. Le prove hanno evidenziato un’elevata affidabilità: le differenze tra curve originali e digitalizzate risultano inferiori allo spessore della traccia, con distribuzioni prossime alla gaussiana e senza alterazioni spettrali significative nelle analisi FFT, salvo le alte frequenze legate al campionamento. Questi risultati confermano che PyGraph Scanner costituisce una soluzione semplice, flessibile e replicabile per la digitalizzazione di serie storiche, particolarmente utile per applicazioni in ambito strutturale, sismico, idrologico e climatico. Sono in corso ulteriori studi sugli errori sistematici e sulle soglie di accettabilità per analisi nel dominio del tempo e della frequenza, che verranno approfonditi in lavori futuri.
DOI

In a recent work, we tested the ability to compute earthquake parameters (location and magnitude) using citizen testimonies collected by the European-Mediterranean Seismological Centre (EMSC). Each intensity estimated by individual non-professional users of the LastQuake smartphone application is indicated as an individual data point (IDP). Each IDP is archived by EMSC with a time stamp, allowing the calculation of the time delay from the earthquake origin time. To use IDPs as classic intensities, i.e. macroseismic data points (MDPs), identifying damage at the scale of towns or cities, they must be grouped into spatial clusters, which are then processed by the BOXER code to locate and size global earthquakes. A retrospective analysis on a dataset of more than 15,000 events collected over the past 10 years shows that the procedure can provide reliable parameters and that the results depend on the geographical area and improve over time and as the number of available IDPs/MDPs increases. The key question is whether early IDPs/MDPs can quickly provide reliable parameters (location and magnitude) for users and stakeholders (e.g. the civil protection agencies). Using clustering methods that statistically provide, on average, the best agreement with instrumental data, we tested some predefined time intervals within which to group the available IDPs into MDPs. We then applied the BOXER code to these MDPs, evaluating the agreement with the final instrumental parameters. Results confirm that reliability increases with the number and distribution of MDPs, strictly dependent on the number and distribution of available IDPs. This retrospective analysis demonstrates the effectiveness of the approach and its potential to quickly provide parameters for future real-time applications. The method may offer a reliable and rapid tool to support emergency response, improving as more IDPs/MDPs are collected.
DOI

Managing induced seismicity risk is needed to enable the widespread adoption of geothermal technologies, facilitating the transition towards a decarbonized energy sector. In April 2022, real-time monitoring and forecasting of induced seismicity were tested during a three-stage hydraulic stimulation in a deep granite heat reservoir at the Utah FORGE site. Here, we analyze the recorded seismicity through statistical inference, and investigate the possible fracturing mechanisms triggered by the injection operation. Our analysis indicates that seismicity is likely induced by opening of a tensile fracture. Through pseudo-prospective forecasting, we then replay the Stage 3 stimulation and related induced seismicity as if it were happening in real-time. We demonstrate that even if the physical processes are complex and likely difficult to disentangle using seismicity alone, physics-based seismicity rate forecasting models show promise for stable forecastability of seismicity induced during hydraulic stimulation. Our results pave the way for Advanced Traffic Light Protocols (ATLP) to become standard operational technology in the mitigation strategies of deep geothermal projects.
DOI
A seguito dei devastanti terremoti del 6 febbraio 2023 nel distretto di Kahramanmaraş (Mw = 7.8 e M_w = 7.6), è stata organizzata una missione tecnico-scientifica internazionale su richiesta del Dipartimento della Protezione Civile (DPC) italiano e dell’Autorità turca per la gestione delle emergenze e dei disastri (AFAD), in collaborazione con l’Ambasciata Italiana in Turchia. La delegazione, coordinata dal gruppo operativo dell'INGV-EMERGEO e composta da esperti afferenti a INGV, ISPRA e OGS, ha condotto rilievi di terreno mirati alla caratterizzazione della deformazione fragile della crosta superficiale, analizzando l’estensione e la cinematica del meccanismo di rottura e i conseguenti effetti sismo-geologici secondari, fornendo un contributo fondamentale per l’analisi strutturale dei processi di rottura cosismica. L’attività di campo ha interessato oltre 180 km del settore centrale della East Anatolian Fault Zone (segmento Kahramanmaraş-Pazarcık). Il presente lavoro, in lingua inglese, documenta la fagliazione superficiale generata dall’evento di magnitudo 7.8 attraverso un’accurata selezione di 125 immagini (tratte da oltre 4.000 rilievi) e una panoramica video del settore investigato (visionabile solo nella versione flip-book).
DOI